Learn the Basics of Map Reading
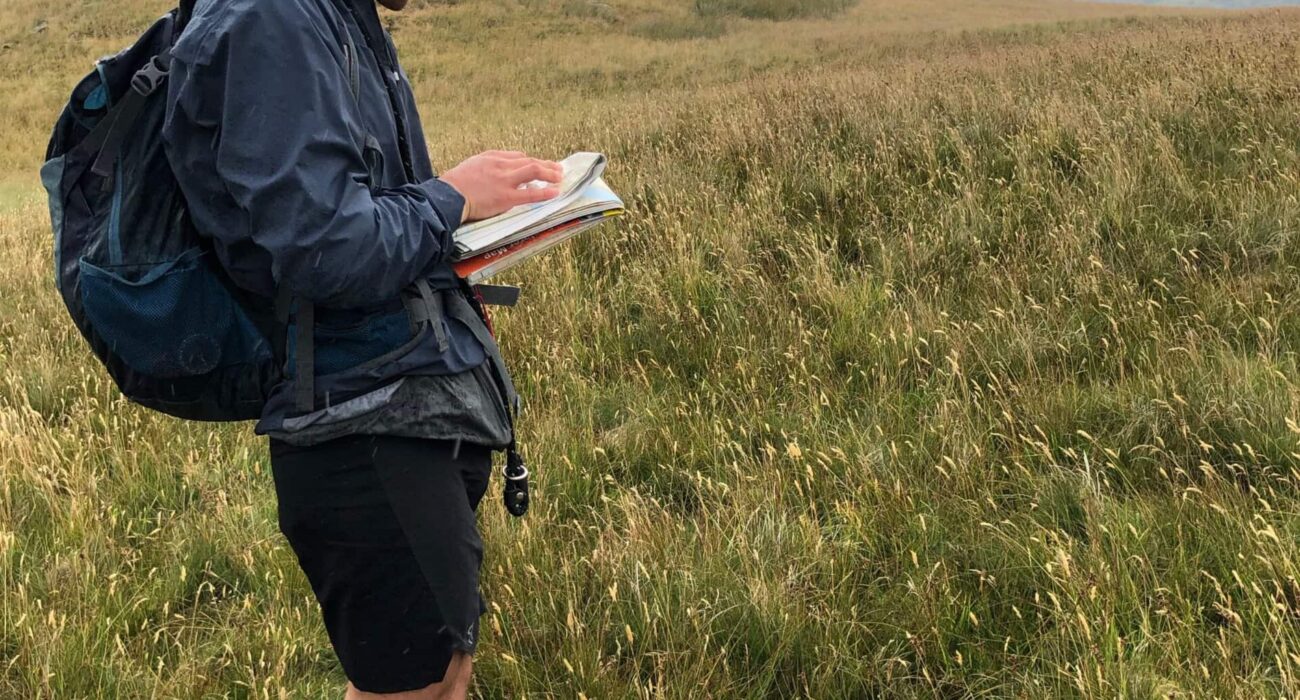
How to read a map is a crucial skill when heading out into the mountains. The map is a key piece of equipment when heading out into the mountains. Therefore knowing how to read a map is pretty key!
The map is essential when heading out into the mountains. It provides a representation of the terrain you are planning to walk on, in a two-dimensional form. Maps offer you a clearer and more convenient navigation method, unlike photographs. They are also a great source of information to help guide you in the mountains.
Before you go:
Before setting off on your chosen route, it is best practice to look carefully at the map. Doing so will make map reading a lot easier. The route can then be checked so that any potential hazards can be identified. If needed they can be avoided or a better quicker/safer route can be followed. In addition to this, maps are the best guide during your journey. Firstly they can help you follow your planned route. And secondly let you walk and plan days that don’t involve you covering more height than is needed!
Map Reading:
It is critical to familiarize yourself with the features and functionality of a map with a map features tool. This can be found on the side of the map itself or on the internet. Understanding map scale i.e. markings and symbols on maps and how they correspond to real terrain is crucial when you are navigating in the hills. If you master using maps, you can increase your confidence and become proficient in using maps in the natural environment. This will enable you to study a map beforehand and have n imaginary picture of what you will encounter before heading into the hills.
Map Scales
The proportion between the ground distance and map distance is called a scale. It is typically represented as a proportion of 1:50,000 or 1:25,000.
The scale of 1:50,000 is typically used in the Ordnance Survey Landranger maps which means 1cm on the map corresponds to 50,000cm or 500 meters on the ground. Similarly, 2cm on the map corresponds to 1km on the ground.
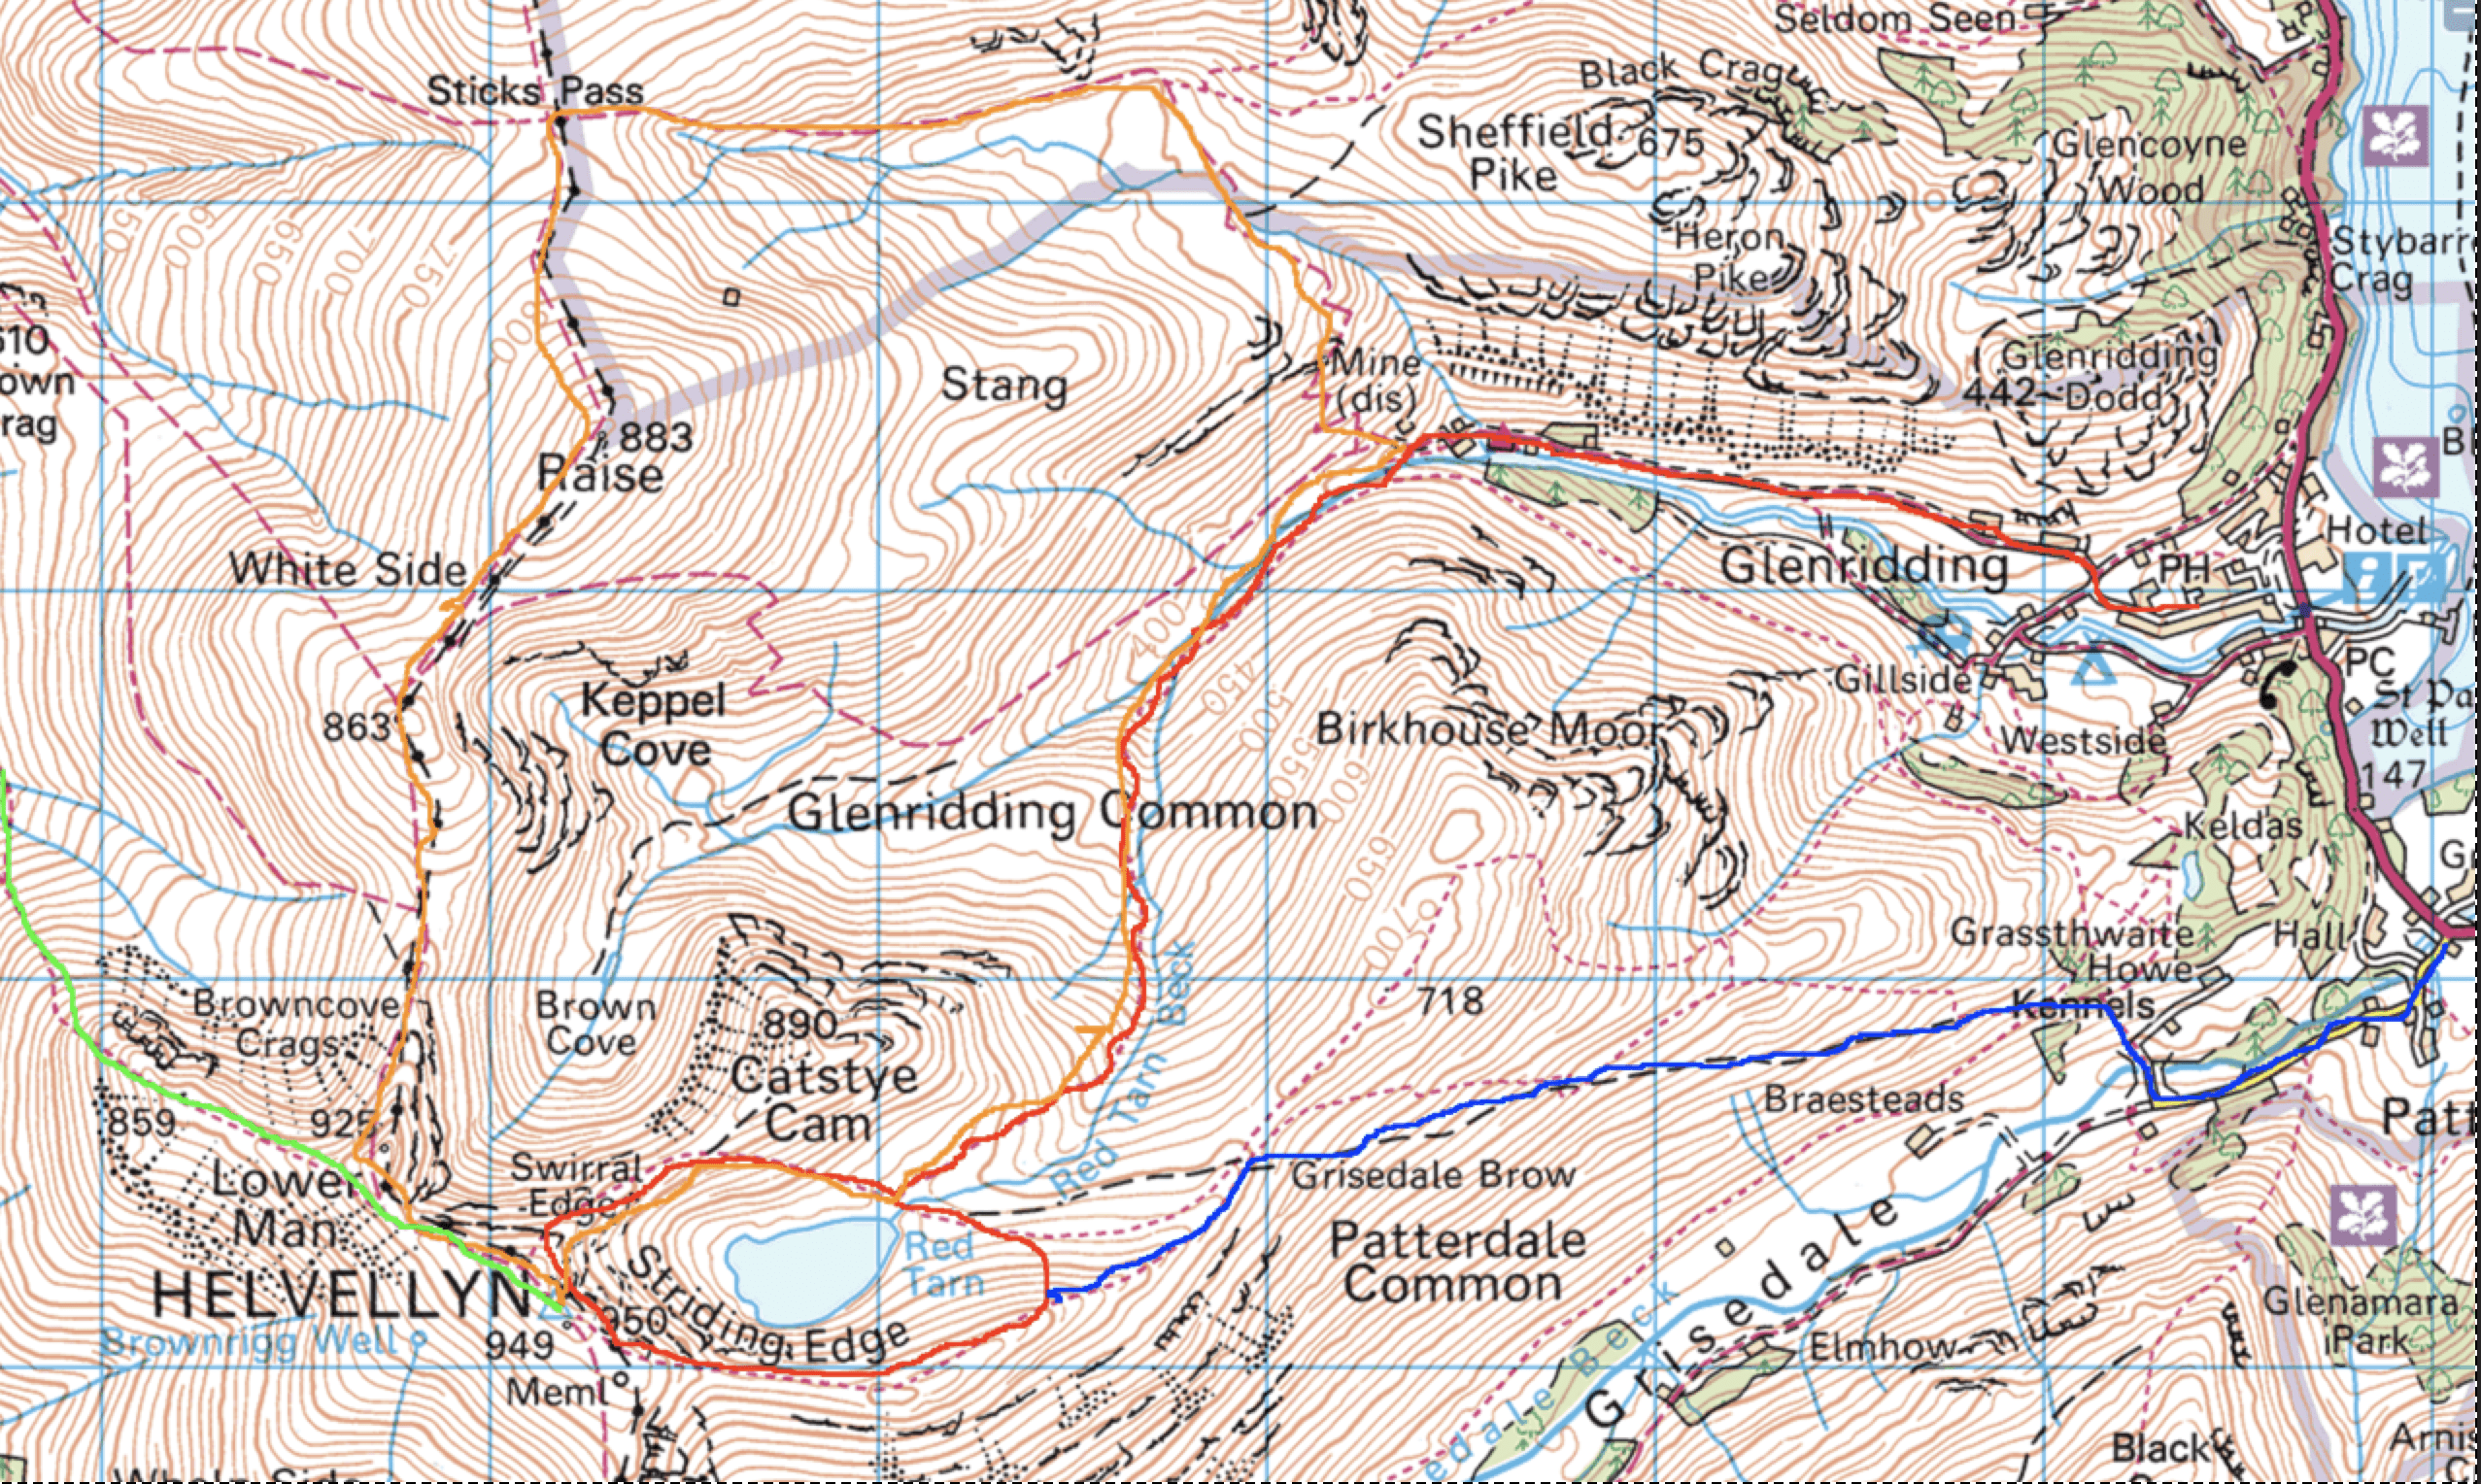
The below diagram of 1:50,000 shows a comparison between the 1:50,000 scaled map and the 1:25,000 scaled map. The larger the scale of the map, the more detailed information it will show i.e. contours, small rock formations, streams, and water features including lochans and small streams. However, you must note that a larger scale map covers a smaller area and it can create difficulty if you want to cover a broader area. In this scenario, a smaller-scale map may be the best choice even if it represents lesser details. Learning how to read a map can be daunting and confusing at first but with time – Most of the time enjoyable (frustrating when not lost – geographically misplaced!) can be a great skill to practice as well as the more you do the more you want to do to hone your skills and get better.
Below map showing a section of a 1:50,000 map of Mungrisdale Common:
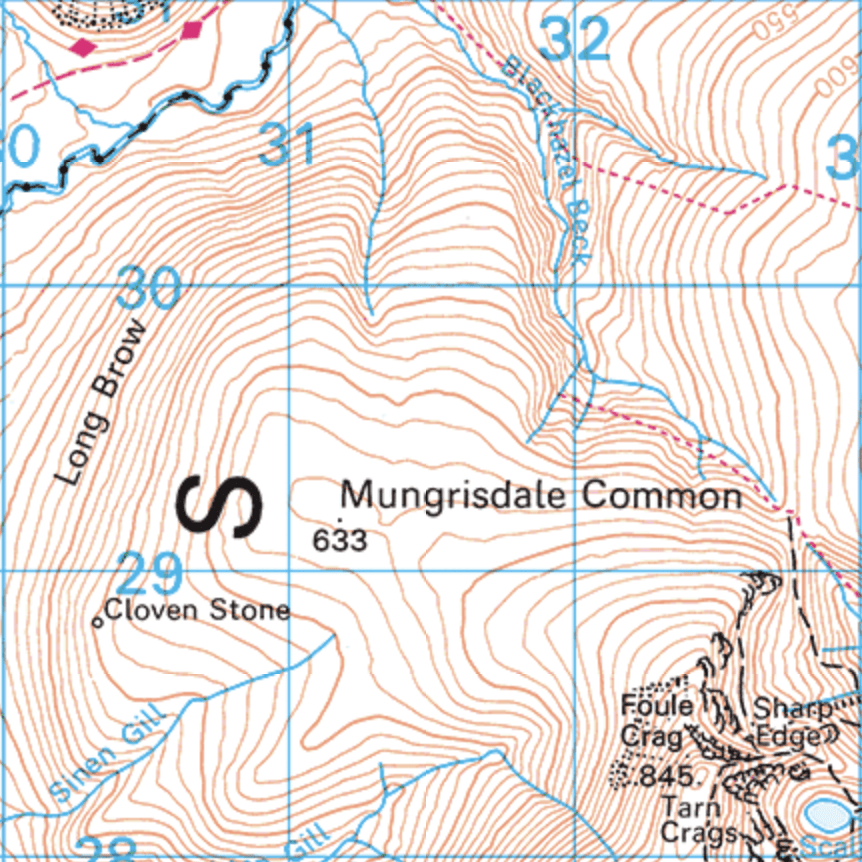
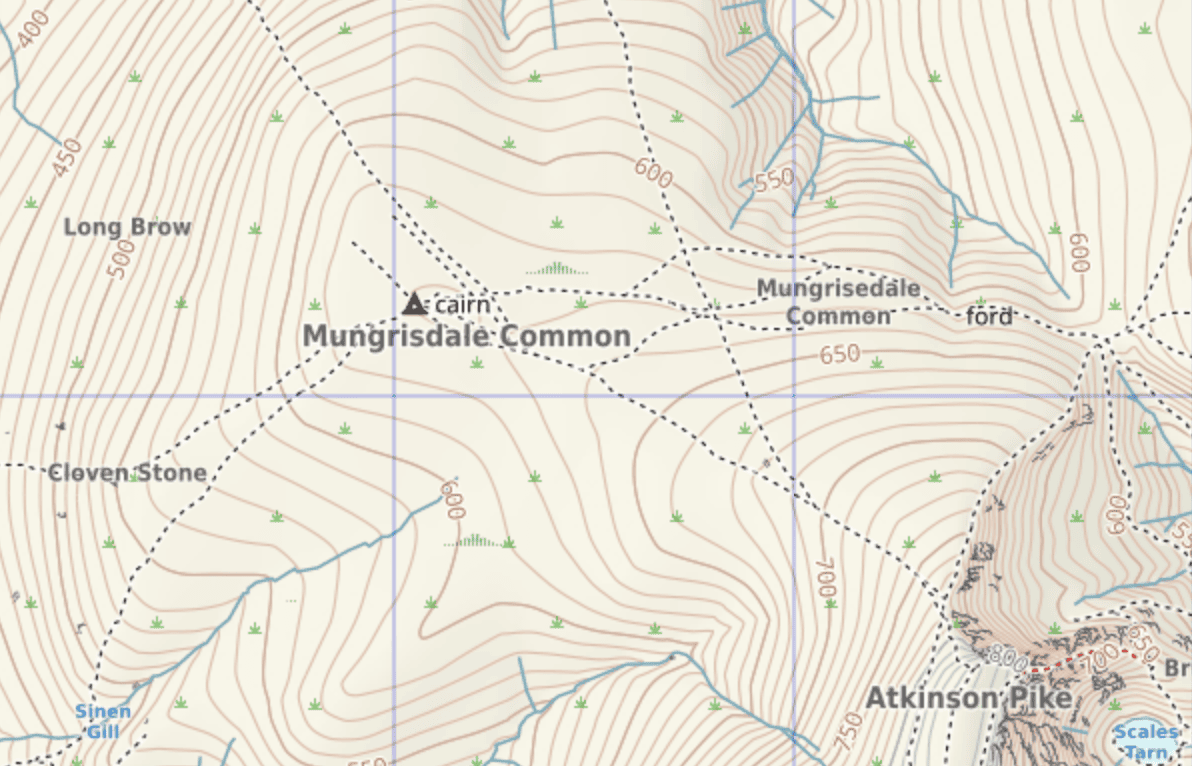
The 1:50,000 and 1:25,000 scale maps are more popular in the Lake District, Scotland, and Wales, and are most common for walkers’ maps. There are other scales also available like Harvey’s map which has a scale of 1:40,000. These are often used by runners and orienteering events where a compromise between the 1:25 and 1:50 scales is reached.
Grid References
Maps feature a network consisting of horizontal and vertical lines at 1km intervals that help determine the precise location and the relationship to the rest of the country. The vertical lines on the map are called “eastings’ ‘ whereas the horizontal ones are known as “northings”. These lines are numbered from 00 to 99 in 100km blocks and each block is identified by a number in the key. Article -How to read a map – map reading
Grid reference:
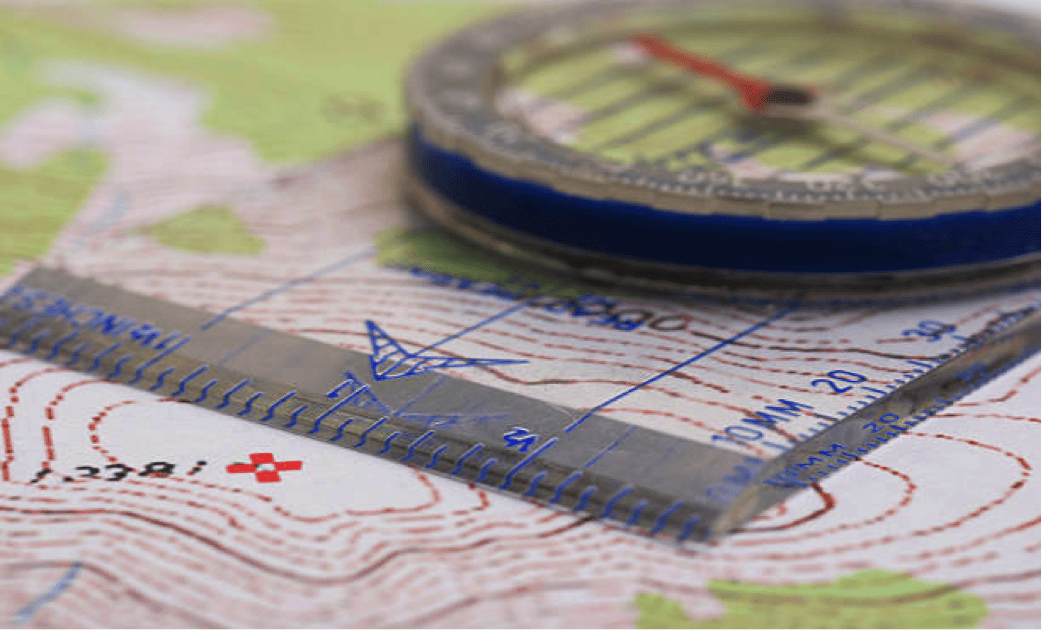
At times we need to use the grid lines to pinpoint a location, you need to read the numbers on the eastings first. Followed by the northings. For E.g. Mungrisdale Common Summit is situated in square 3129 in the example map provided. This 4-digit grid reference corresponds to a 1km square area on the ground. If you want to get a six-figure grid reference that identifies the square of 100m by 100m. Therefore the number of tenths within the square in which the location lies should be calculated from both. For example. to the east and to the north of the bottom-left corner.
Therefore it is preferred to use the Romer scale on the side of the compass to do this by eye. In the example, the Mungrisdale Common summit is found to be located at 2-tenths along and 2-tenths up, resulting in a 6-figure grid reference of 312292. This gives the precise location of the mountain within 100 meters. Article -How to read a map – map reading
Contours
The contour line is the most useful feature on the map for navigation in the mountains. These lines are brown and clearly show the shape and steepness of the land, eventually, you can visualize the terrain in 3 dimensions. Contours can be identified in the ground even if the area is covered with snow hence they are highly reliable. A contour line intersects points of equal elevation with the contour interval representing the height difference between lines.
Intervals:
The intervals vary in different proportion maps by map scales i.e. with 10 meters on 1:50,000 OS maps, 5 or 10 meters on 1:25,000 OS maps, and 15 meters on Harvey’s 1:40,000 Maps. Article – How to read a map – map reading
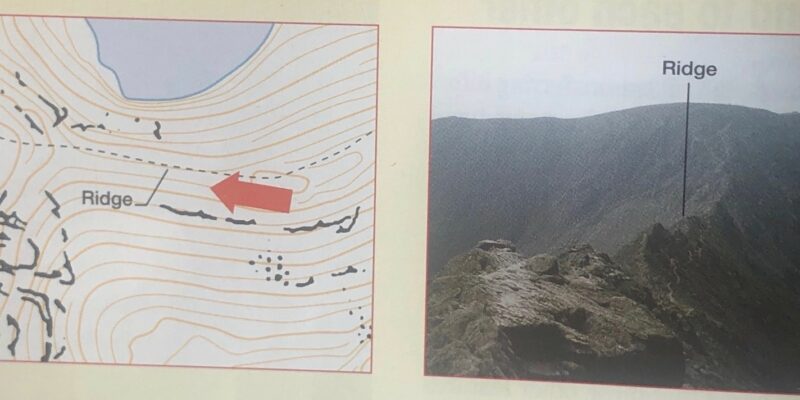
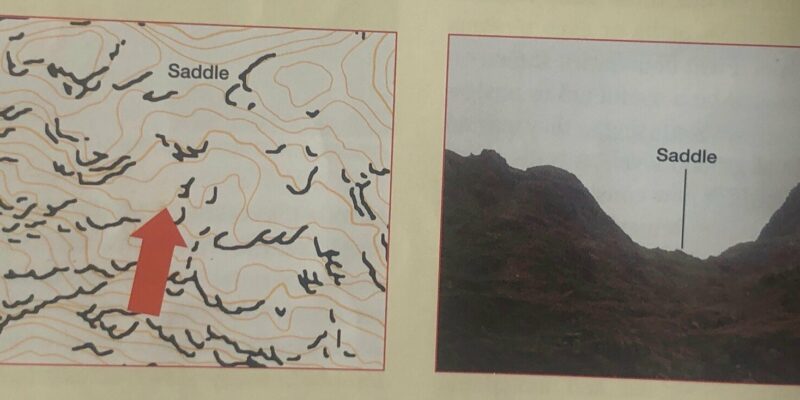
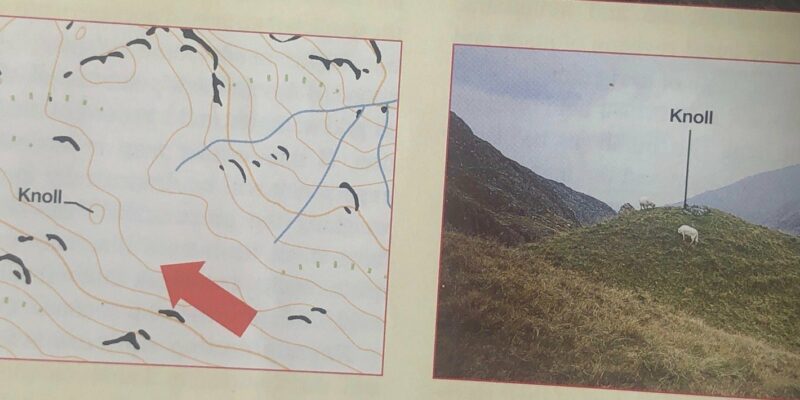
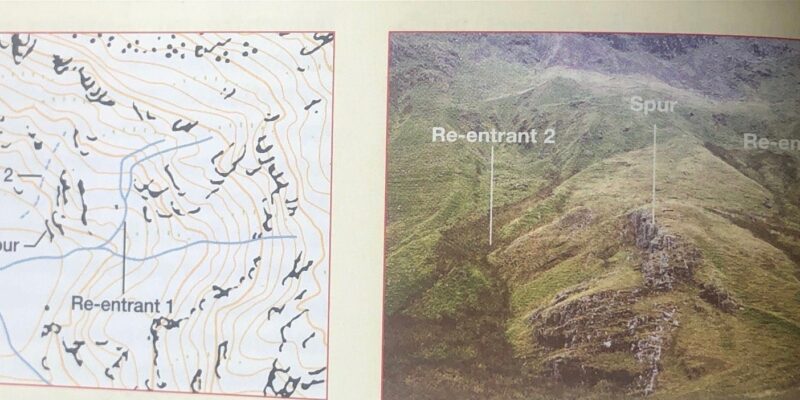
Contour lines also represent the shape of the ground and this is known as the Contour features. Some common features are shown below in the pictures. These are Ridges, Saddles, Knolls, and the all-important Re Entrants;
To interpret contour features on the map, there are three main methods. Firstly, evaluate the ground under your feet and identify what type of feature it forms on the map. The second is, to look at the feature beyond your immediate location under good visibility and identify them on a map. Third, examine the contour features on the map in poor visibility and form an imagination about how the ground ahead will look in good visibility.
If you want to determine whether contours are going uphill or downhill, just have a look at heights incorporated within contour lines. The contour height figures are printed on the map facing uphill so if they are up from the right side then you are looking uphill on the map. If they are upside down then you are looking at the downhill map. Rivers and streams flow downhill and it makes it easier to indicate high and low ground on the map. In addition, you can find any nearby hill on the map to determine whether a slope is going up or down.
I am text block. Click edit button to change this text. Lorem ipsum dolor sit amet, consectetur adipiscing elit. Ut elit tellus, luctus nec ullamcorper mattis, pulvinar dapibus leo.


